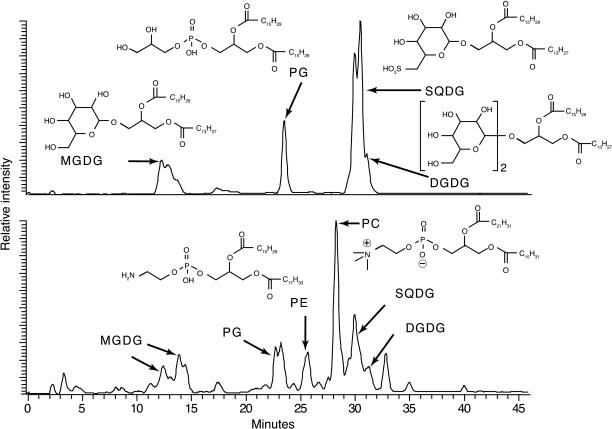
Fig. 2.
HPLC/ESI-IT-MSn base peak chromatograms of membrane lipids for Prochlorococcus 9312 (Upper) and the total planktonic community from the NPSG (Lower). The vertical axis approximates relative abundance, although the MS is more sensitive to PG than SQDG, which exaggerates the relative size of the PG peaks. Fractions of each membrane lipid are listed in Table 1. Broad or doublet peaks are due to variations in fatty acid chain length. Generic formulas are used to represent common fatty acid tail groups of the intact lipid molecules. Abbreviations for chemical names are given in the text.

