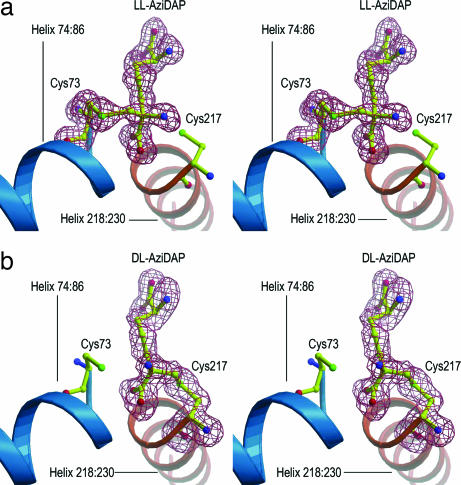
Fig. 1.
Stereoviews of omit Fo − Fc map (flesh) contoured at 3σ in the active site of DAP epimerase in the ll-AziDAP–epimerase complex (a) and the dl-AziDAP–epimerase complex (b). The two inhibitors are represented in as balls and sticks, with carbon shown in yellow, oxygen in red, and nitrogen in blue. The catalytic cysteines Cys-73 and Cys-217 are represented as balls and sticks, with carbon shown in yellow, sulfur in green, oxygen in red, and nitrogen in blue. The two active-site helices, A (74:86) and B (218:230), are shown in teal and orange, respectively.

