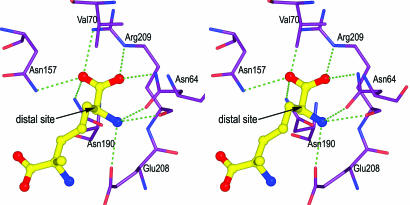
Fig. 4.
Stereo representation of hydrogen-bonding interactions at the distal center of ll-AziDAP. The inhibitor and enzyme model are shown as balls and sticks; the carbon atoms of ll-AziDAP are shown in yellow, and the carbon atoms of the enzyme are shown in violet (nitrogen, blue; oxygen, red). Hydrogen bonds are represented by dotted green lines.

