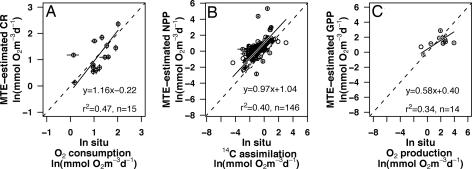
Fig. 3.
Predicted versus in situ estimates of plankton CR and production. Scatter plots of the in situ-measured CR (A), net (B), and gross (C) primary production versus the estimates based on MTE. Data were log-transformed to normalize variances. The lines fit are the structural (reduced major axis) relationship. Dashed lines are the 1:1 relationship. Error bars indicate the 95% confidence intervals for the mean (see Supporting Text). No error bars are shown when these were not available from in situ data.

