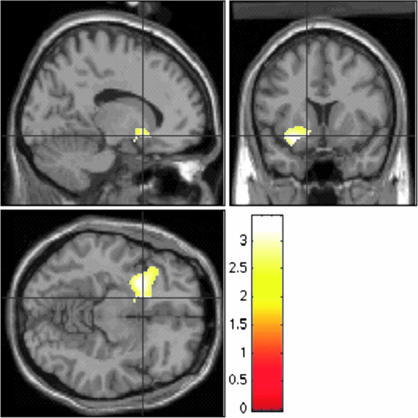
Fig. 2.
Greater neural activation in children with BD (n = 22) vs. controls (n = 21) when rating the hostility of neutral faces. Figure displays voxels where patients exhibited greater activation than controls on the hostile vs. nose contrast for neutral faces. For visual presentation, the threshold is set at P < 0.01 uncorrected. Peak voxels are in the left amygdala (x = −22, y = 4, z = −18), left accumbens (x = −14, y = 12, z = −10), left putamen (x = −24, y = 8, z = −10), and left VPFC (x = −32, y = 20, z = −16). Figure displays, clockwise from lower left, axial, sagittal, and coronal views. Scale = t values of pairwise comparisons of BDs vs. controls.

