Figure 6.

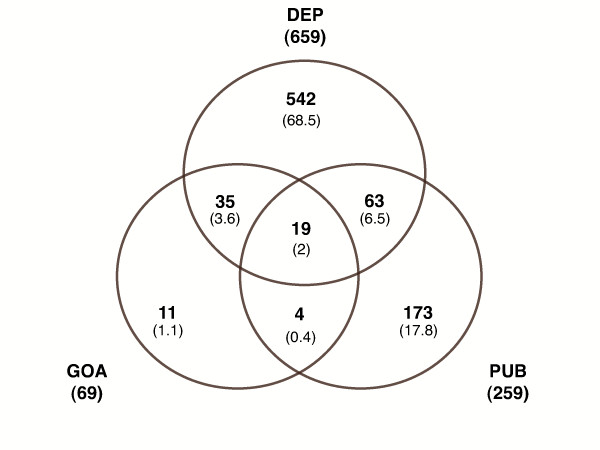
Venn diagram for the Down cluster. Number of GO Process terms in each category (overall percentage in brackets). Evidence annotation (GOA), Literature annotation (PUB) and Associative relations (DEP).

Venn diagram for the Down cluster. Number of GO Process terms in each category (overall percentage in brackets). Evidence annotation (GOA), Literature annotation (PUB) and Associative relations (DEP).