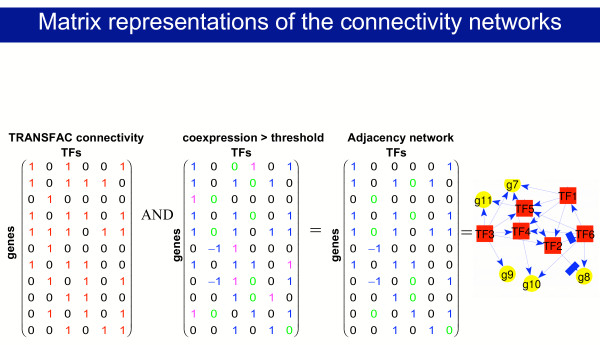
Figure 1.

Matrix representation of the reconstructed regulatory network. A non-zero value at the intersection between a TF column and a gene row in the connectivity matrix represents a literature-mined (stored in TRANSFAC) or putative binding of this TF to the 1 kb upstream region of the gene promoter (based on matching the TRANSFAC PWM with this promoter region). A value of +1 in the co-expression matrix derived from microarray data was assigned if the TF is up-regulated while the target gene is up-regulated, -1 if the TF is up-regulated while the target gene is down-regulated and 0 otherwise. When overlaying the connectivity and co-expression matrices (using element by element multiplication of these matrices as denoted by the "AND" operation above) we obtain the putative regulatory network represented by the adjacency matrix, whose blue nonzero entries represent both binding and co-expression between a TF and a gene, and whose green and black zero entries correspond to TFs and genes that are not bound and/or not co-expressed. On the right we show graphical representation of the adjacency network. The flow is depicted in the supplementary data [see Additional file 1].
