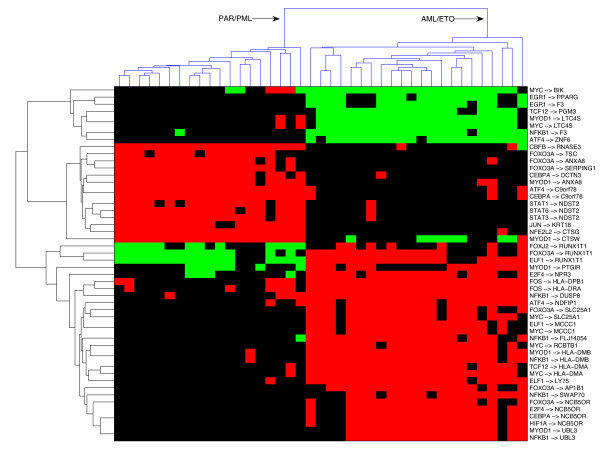
Figure 3.

Classification utilizing differences in condition-specific network topologies (links). The links presented on the y-axis were extracted using a supervised learning scheme that identifies the TF-gene links that undergo the most substantial regulatory alterations between two classes of AML patients; those with a translocation resulting in the AML/ETO fusion protein versus those with the RAR/PML fusion protein. The red, black and green represent a stimulatory relationship, no relationship or inhibitory relationship of the TF-gene links, respectively.
