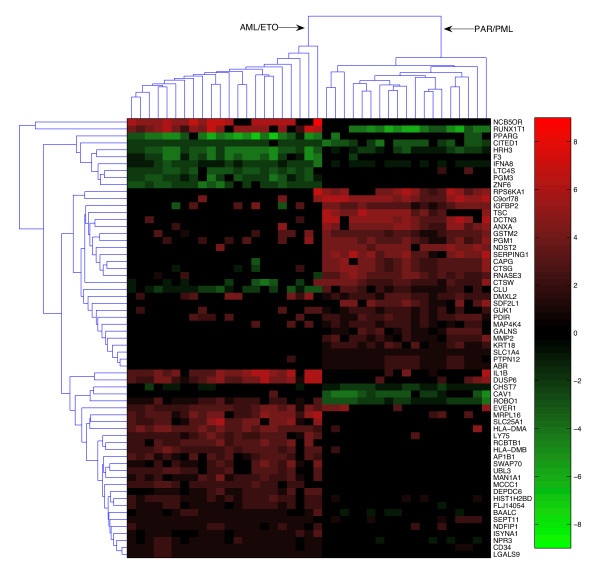
Figure 4.

Classification utilizing differences in condition-specific network topologies (in-degree). The genes presented on the y-axis were extracted as in Fig. 4 using a similar machine learning procedure that identifies genes whose in-degree (the number of regulators that control these genes) undergoes the largest change or rewiring.
