
Figure 13.
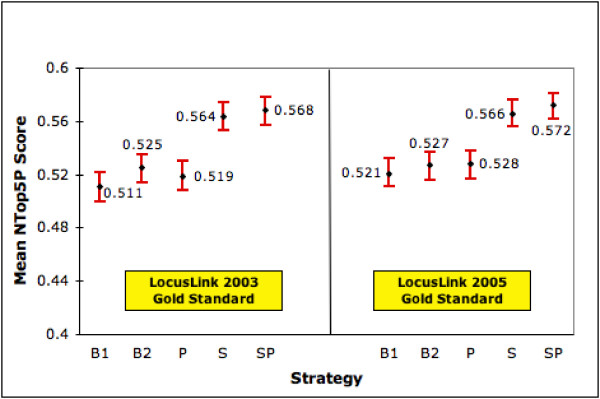
Performance of Ranking Strategies (NTop5P) on Different Gold Standard Sets. This figure shows the mean NTop5P scores (with 95% confidence interval) for each strategy on 4641 genes for which summary and product is available in two versions of LL. The left half of the graph shows the performances using relevance judgments from the 2003 LL file whereas the right half shows performances using relevance judgments from the 2005 LL file.