
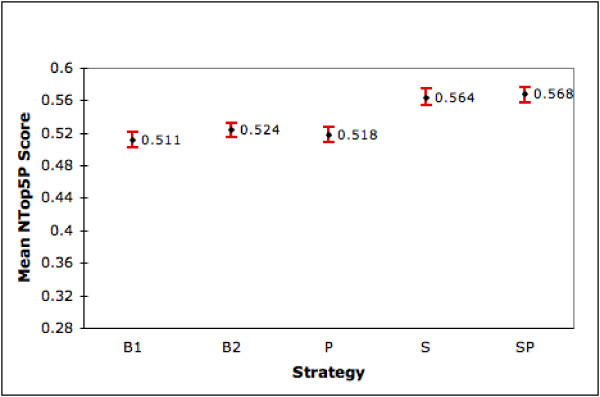
Figure 2.
Performance of Ranking Strategies (NTop5P). The graph shows the mean NTop5P scores (with 95% confidence interval) for the different strategies on the set of 4,647 genes for which summary and product is available in LL.
Official websites use .gov
A
.gov website belongs to an official
government organization in the United States.
Secure .gov websites use HTTPS
A lock (
) or https:// means you've safely
connected to the .gov website. Share sensitive
information only on official, secure websites.
Some NLM-NCBI services and products are experiencing heavy traffic, which may affect performance and availability. We apologize for the inconvenience and appreciate your patience. For assistance, please contact our Help Desk at info@ncbi.nlm.nih.gov.
Performance of Ranking Strategies (NTop5P). The graph shows the mean NTop5P scores (with 95% confidence interval) for the different strategies on the set of 4,647 genes for which summary and product is available in LL.