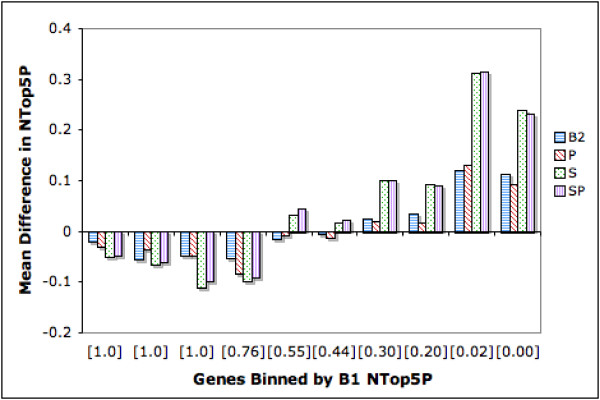
Figure 4.

Difference in NTop5 Precision: Genes Binned by B1 NTop5P. The genes are binned by B1 NTop5P Score. Each bin has 450 genes except for the right most bin, which has 617 genes. The average B1 NTop5P score for each bin is shown in square brackets along the X axis. The Y axis indicates the mean difference in NTop5P between a given strategy and B1. Bars belowthe X axis indicate a drop in performance whereas bars above the X axis indicate an improvement in performance. The extent of improvement/drop is indicated by the height of the bars.
