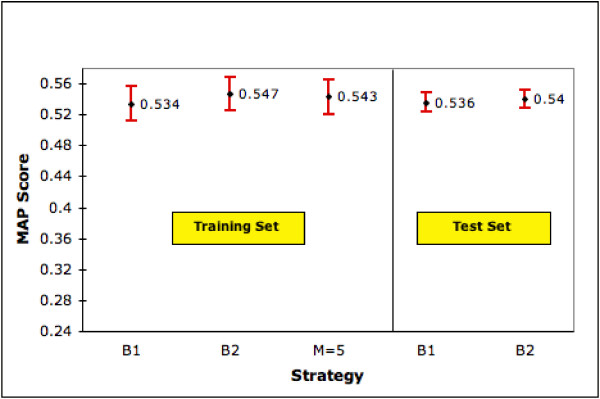
Figure 9.

Performance of Generic Ranking Strategy on Training Set (1,000 genes) and Test Set (3,195 genes). The figure shows MAP scores (with 95% confidence interval) for our generic ranking strategy, B1 and B2 on training and test sets. M is the number of top ranked terms selected. Since M = 5 is our best generic ranking strategy we show only the performance of this strategy.
