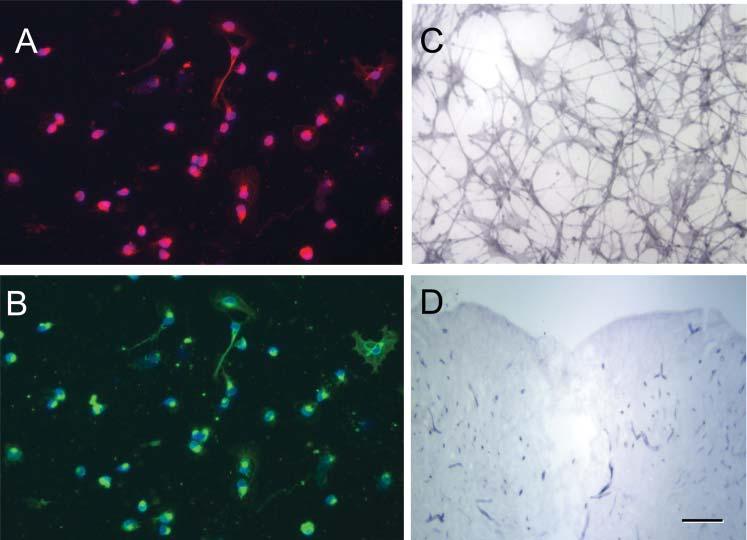
Fig. 1.

Phentotypic characterization of OECs and hPAP expression in culture. (A,B) Dissociated OECs were p75+ (red) and S100+ (green). The nuclei were stained with the Hoechst method and >95% of cells were p75+. (C) ALP-reaction product can be seen in OECs that were maintained in culture for 5 days. (D) A coronal section through a demyelinated lesion (X–EB) site after ALP chromagen reaction. Note that aside from minor staining in blood vessels, the central lesion site showed little reaction product. Scale bar: 20 μm in A-C; 300 μm in D.
