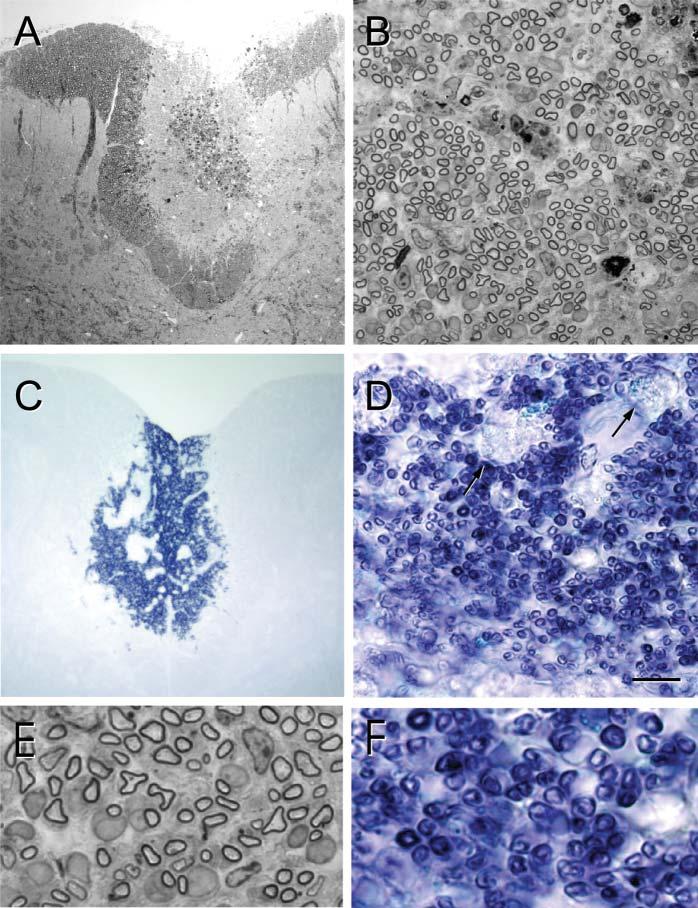
Fig. 2.

Remyelination after transplantation of hPAP-SCs into an X–EB lesion of the dorsal funiculus. (A) Low-power, plastic-embedded-section of the dorsal spinal cord 3 weeks after hPAP-SC transplantation. Note the centrally positioned lesion site (lighter region). (B) Higher power micrograph shows extensive myelinated profiles throughout the transplantation site. (C) In adjacent, frozen sections reacted for ALP, blue reaction product can be observed in the transplantation site. (D) Higher power of this area shows numerous blue profiles that are characteristic of myelinated axons. Note that the reaction product is minimal in macrophages (arrows). (E) Higher-power images of plastic-embedded sections show myelinated axons, many of which are associated with large cytoplasmic and nuclear surrounds that are characteristic of SC myelination. (F) These profiles are associated with hPAP reaction product. Scale bar: 200 μm in A,C; 25 μm in B,D; 7 μm in E,F.
