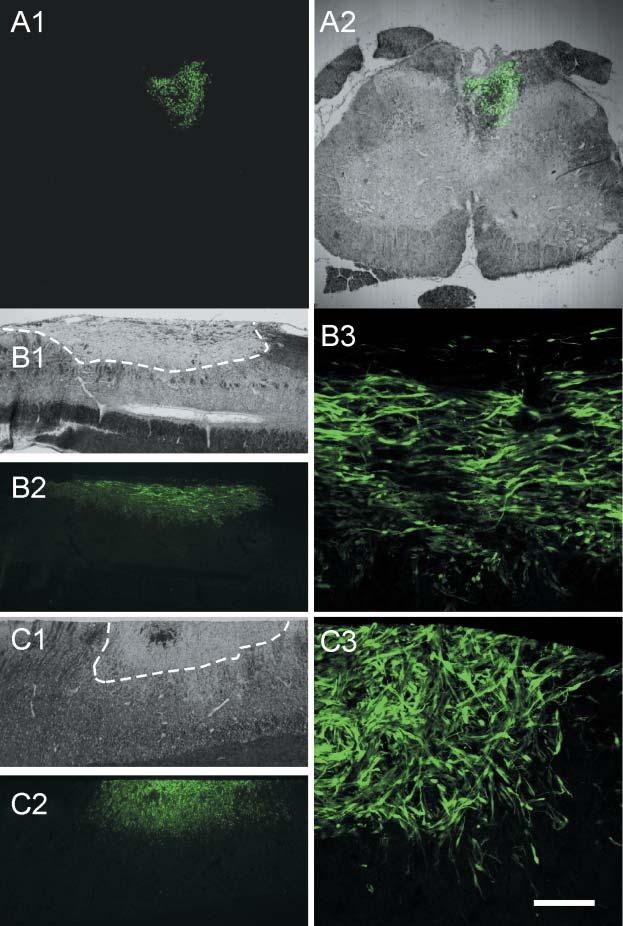
Fig. 4.

Distribution of GFP-expressing mouse SCs and OECs transplanted into an X–EB dorsal funiculus lesion. (A1) Coronal section of the spinal cord from a rat that was transplanted with SCs from GFP-expressing mice 3 weeks after transplantation. (A2) Superimposition of GFP fluorescent and DIC images. Note that donor SCs that express GFP are localized only in the dorsal funiculus. (B) Sagittal sections through the lesion site showing the distribution of transplanted SCs. The lesion site is within the stippled area in B1. The transplanted cells extend throughout the lesion site (B2). Higher-power micrograph (B3) shows clusters of transplanted cells. (C) Distribution of OECs in the lesion site. C1 outlines the lesion site, and distribution of cells in low and higher power micrographs are shown in C2 and C3, respectively. Scale bar: 500 μm in A1,A2; 1 mm in B1,B2,C1,C2; 50 μm in B3,C3.
