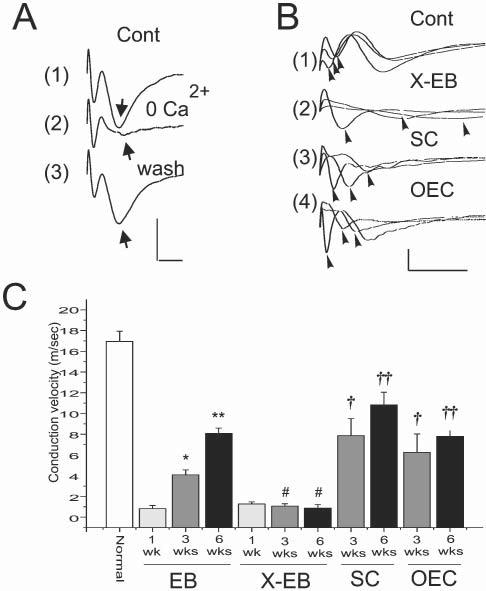
Fig. 5.

Conduction velocity of demyelinated and remyelinated axons, recorded in vivo. (A) Compound action potentials recorded from the dorsal column (near the midline and within 100 μm of the surface) with a glass microlectrode in vivo following stimulation of the dorsal column surface near the midline. Note the early and late negativities. Washing the surface of the spinal cord with a Ca2+-free, high (6 mM) Mg2+ Krebs' solution (2) reversibly (3) eliminates the second negativity (arrow), indicating its synaptic nature. Thus, the first negativity corresponds to conducting dorsal column axons. (B) Superimposed compound action potentials recorded at 1.0 mm increments longitudinally along the dorsal columns in normal (1), X–EB lesion (2) and 3 weeks after transplantation of either SCs (3) or OECs (4). (C) Conduction velocity (error bars indicate S.E.M.) of dorsal column axons from control animals (normal), and 1, 3 and 6 weeks after EB injection without prior X-irradiation, after X–EB lesion induction, and 3 and 6 weeks after SC and OEC transplantation into the X–EB lesion. * P<0.1, ** P<0.01, †P <0.05, †† P<0.05, # not statistically significant. Scals bars: A, 2 mV, 1 msec; B, 1 mV; 5 msec.
