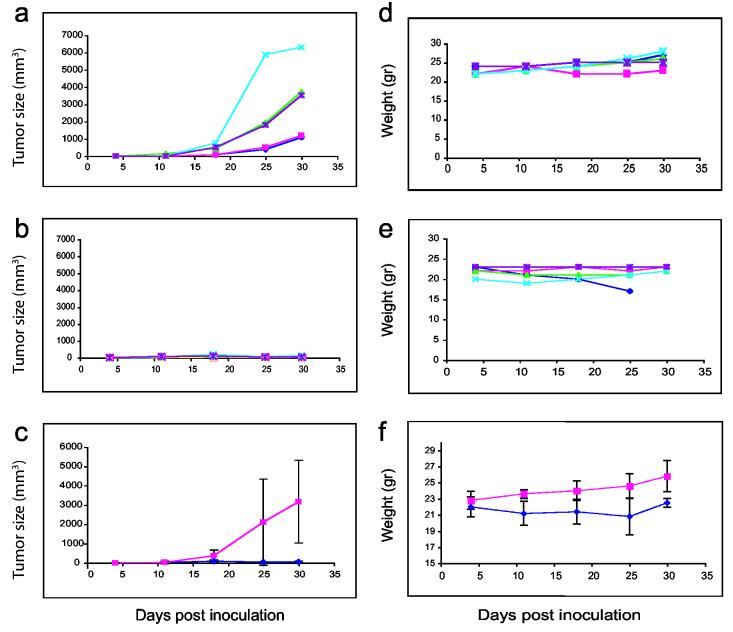
Figure 2.
Tumor size and weight of PE38 packaged in vitro and control mice treated from the day of tumor challenge. Mice were injected with 2 × 106 KB-3-1 cells along with the treatment. Tumor size as well as mouse weight were followed for 30 days. Figure 2 (a-c) demonstrates tumor size in mm3 of empty vector-treated mice (panel a) or IVP-PE38 (panel b) (five mice in each group, each line represents one mouse), and panel c is the average of each five mice (IVP-PE is shown in dark blue, and control-treated mice in magenta) with standard deviation (z = (−2.6191), one sided p-value=0.004 for day 25 of treatment). Figure 2 (d-f) demonstrates the weight in grams for these groups in this order (z = (−2.252), one sided p-value = 0.0122 for day 30 of treatment, z = (−1.744), one sided p-value = 0.0406 for relative weight gain by day 30 of treatment (wts on day 30/wts on day 4) (panels d, e, and f respectively).

