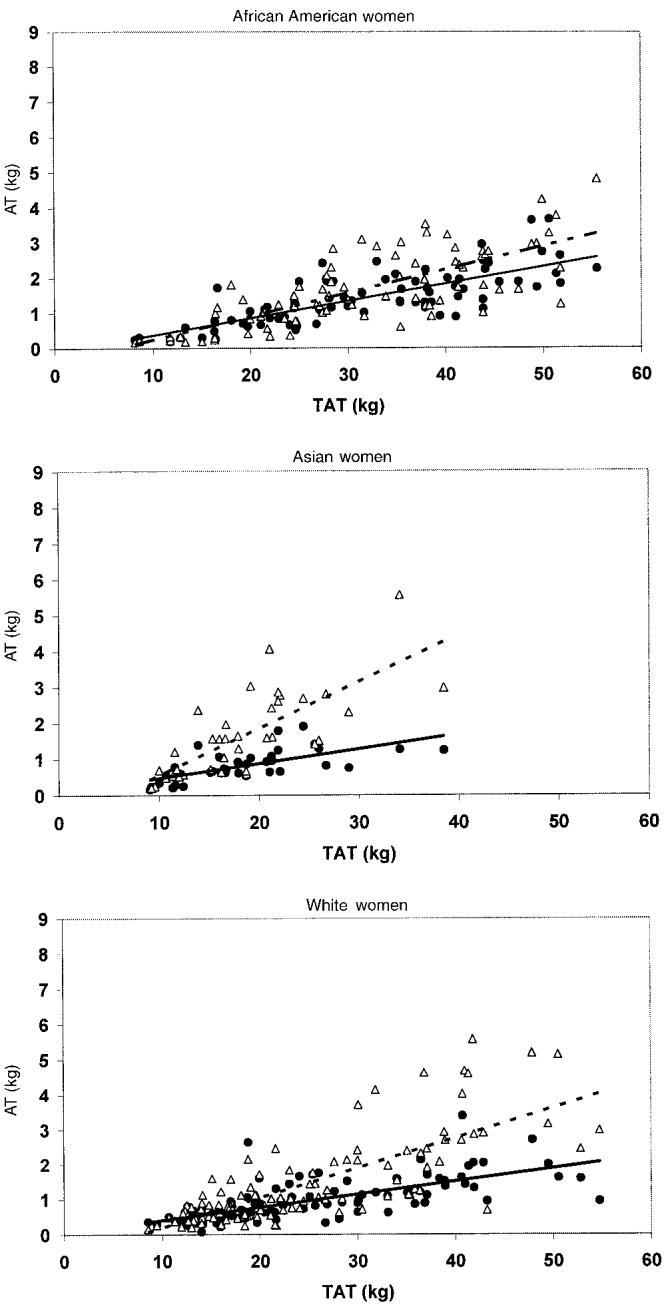
FIGURE 2.

Intermuscular adipose tissue (IMAT; [unk]) and visceral adipose tissue (VAT; △) as a function of total adipose tissue (TAT) in women. Linear regression lines are shown for IMAT ([unk]) and VAT (- - -). All slopes were significantly different from zero (P < 0.001). None of the intercepts were significantly different from zero, except for the regression of VAT in white women (P < 0.001). African American women (n = 79): IMAT = −0.123 + 0.049 × TAT (SEE = 0.495 kg); VAT = −0.423 + 0.067 × TAT (SEE = 0.712 kg). Asian women (n = 38): IMAT = 0.070 + 0.041 × TAT (SEE = 0.322 kg); VAT =−0.729 + 0.129 × TAT (SEE = 0.782 kg). White women (n = 110): IMAT = 0.034 + 0.037 × TAT (SEE = 0.421 kg); VAT =−0.662 + 0.086 × TAT (SEE = 0.782 kg).
