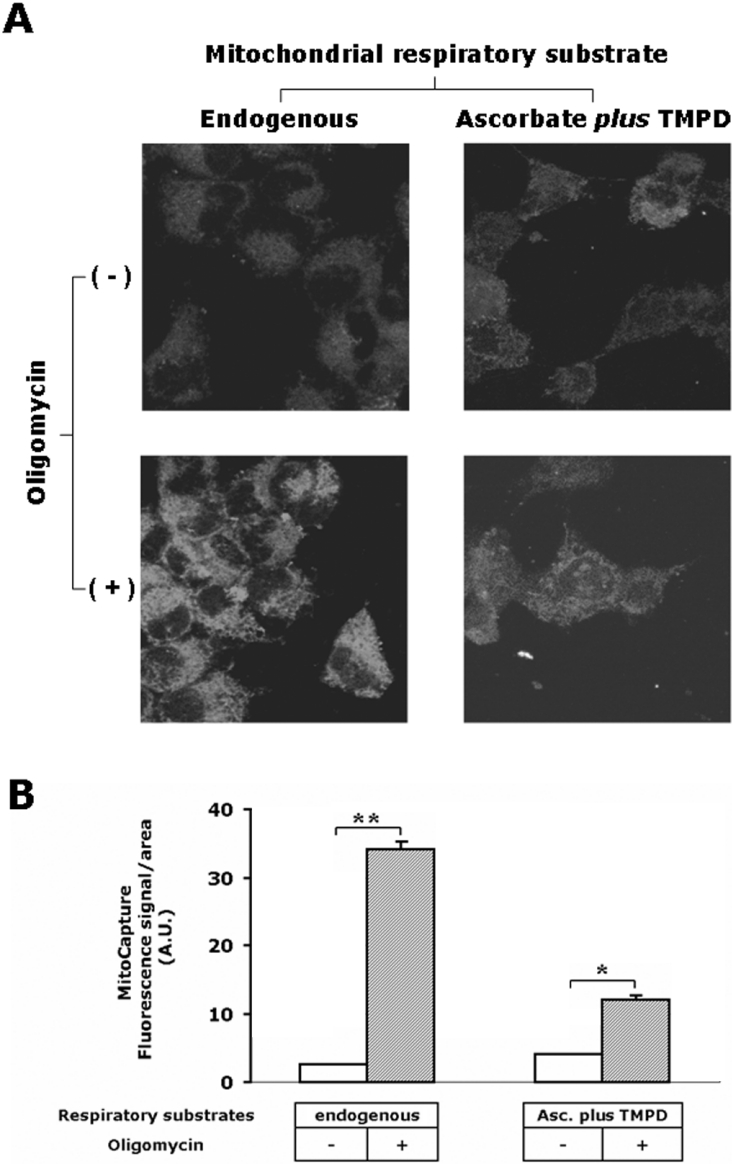
Figure 2. Confocal-microscopic analysis of respiration-driven mitochondrial membrane potential in HepG2 cells.
(A) Imaging of the fluorescence signal of the probe MitoCapture™ in live cells. The upper two panels show the analysis carried out under respiratory conditions sustained by endogenous substrates (on the left) and by activation of COX as an isolated step (on the right). The lower two panels show the effect of pre-incubation of the cells with 2 μg/ml oligomycin on the mitochondrial membrane potential generation under endogenous (on the left) and isolated step (on the right) respiratory activities. The images shown are superimpositions of confocal planes and are representative of four different experiments. (B) Single-cell analysis of the green fluorescence intensity of MitoCapture™ under the four conditions described in (A). The fluorescence intensities were quantified as described in the Materials and methods section and normalized to the surface of the selected area; 20–30 cells were analysed for each condition and the results shown are means±S.E.M. for the experiment shown in (A). Paired Student's t test analysis for the fluorescence intensity of oligomycin-untreated versus oligomycin-treated cells: *P<0.01; **P<0.001. Abbreviation used: A.U., arbitrary units (being pixel intensity normalized to the selected area).

