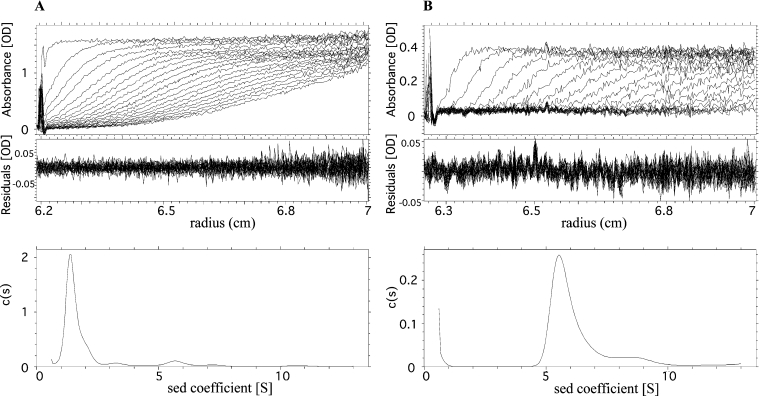
Figure 3. Sedimentation velocity analysis of total saliva and purified apyrases.
Superposition of sedimentation profiles for the total saliva at 4.4 mg/ml protein (A, top) and purified apyrase at 0.3 mg/ml (B, top), obtained at 10 °C at a rotor speed of 42000 rev./min. Scans (top panels) recorded the absorbencies at 280 and 228 nm respectively as a function of the radius (cm). The last scans shown correspond to centrifugation for 10 h (A) and 3.5 h (B). Units in (A) and (B) are absorbance units (‘OD’). The sedimentation profiles were modelled in terms of a continuous distribution c(s) of sedimentation coefficients s (S) (sed coefficient; bottom panels). The residuals (middle panels) give the differences between the experimental and modelled profiles.

