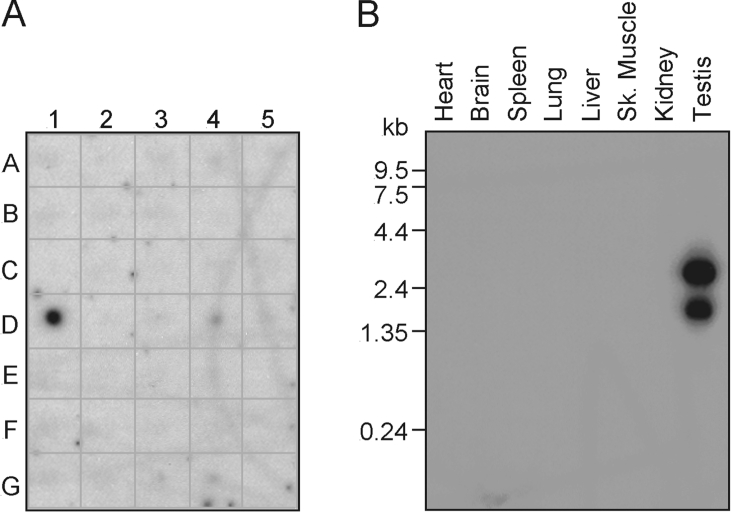
Figure 2. Tissue distribution of MEX mRNA.
(A) Dot-blot analysis of MEX expression in mouse tissues. A1–A5: brain, eye, liver, lung and kidney respectively. B1–B5: heart, skeletal muscle, smooth muscle, blank and blank. C1–C5: pancreas, thyroid, thymus, submaxillary gland and spleen. D1–D5: testis, ovary, prostate, epididymus and uterus. E1–E5: 7-day embryo, 11-day embryo, 15-day embryo, 17-day embryo and blank. F1–F5: yeast total RNA, yeast tRNA, Escherichia coli rRNA, E. coli DNA and blank. G1–G5: blank, Cot 1 DNA, mouse DNA (100 ng), mouse DNA (500 ng) and blank. (B) Northern blot analysis of mouse tissues. The blots were analysed by autoradiography.

