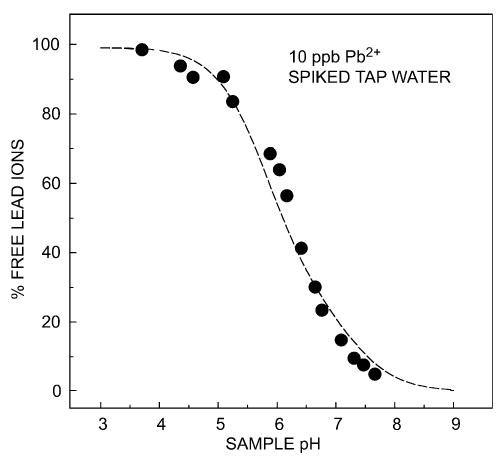
Figure 5.

Speciation analysis of drinking water spiked with 10 ppb Pb2+ as a function of the sample pH, performed with a potentiometric sensor [24]. The dotted line represents the calculated behavior based on the stability of the lead-carbonate complexes in the sample. As shown in Fig. 1, such sensors are responsive to the activity (free concentration) of the analyte.
