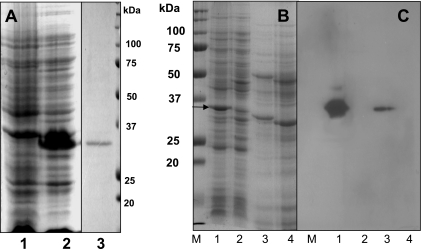
FIG. 1.
(A) Expression and purification of TcdC. Analysis by SDS-PAGE of protein extracts from E. coli BL21(DE3) carrying either the pET22b vector or pET22b expressing TcdC. Lanes: 1, crude cell extract from E. coli carrying the vector pET22b; 2, crude cell extract from E. coli carrying the vector expressing TcdC; 3, His6-purified TcdC (5 μg). Proteins were stained by Coomassie brilliant blue. (B) Analysis by SDS-PAGE of protein extracts from E. coli and C. difficile strains (from 4-h-old exponentially growing cultures). Lanes: 1, crude cell extract from E. coli carrying the pET22b vector expressing TcdC; 2, crude cell extract from E. coli carrying the vector only; 3, crude cell extract from C. difficile strain VPI 10463; 4, crude cell extract from tcdC-negative nonpathogenic C. difficile strain VPI 11186. Proteins were stained with Coomassie brilliant blue. The arrow indicates the over-expressed TcdC. (C) Specificity of anti-TcdC antibody. Immunodetection of TcdC was carried out by using anti-TcdC antibody (dilution, 1:500). Antigen-antibody complexes were detected using anti-rabbit horseradish peroxidase-conjugated antibody (dilution, 1:10,000) and ECL Western blotting detection reagents (Amersham Biosciences). The protein samples in each lane correspond to those in the same-numbered lane in panel B. The optical densities of both E. coli and C. difficile strains were adjusted to 0.1 at 550 nm, and the cells were then sonicated and boiled with SDS-PAGE sample buffer before being loaded onto the gels.

