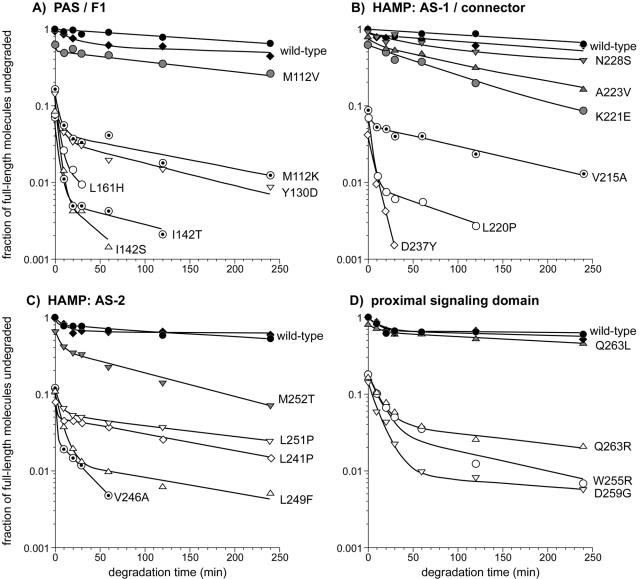
FIG. 7.
Degradation profiles of Aer mutant (Aer*) proteins. The degradation data were generated in experiments like those shown in Fig. 6. Black symbols, wild-type Aer; shaded symbols, Aer* proteins with CW-biased outputs; dotted symbols, Aer* proteins with leaky defects; and open symbols, Aer* proteins with null defects. The lines connecting data points represent least-squares best fits to a double exponential decay curve. The degradation curves for the mutant proteins begin at their initial (steady-state) expression levels relative to that of wild-type Aer.

