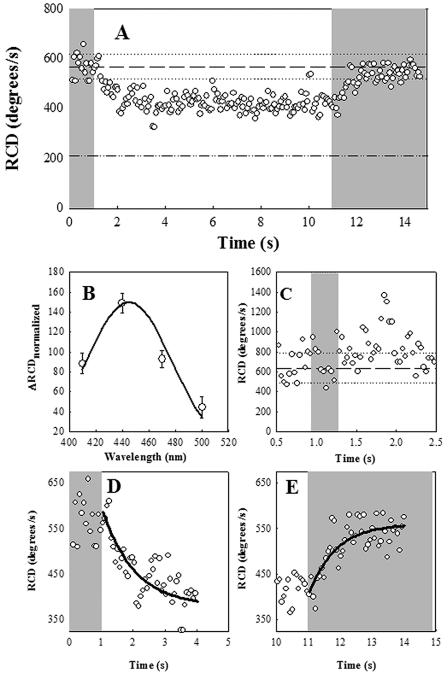
FIG. 3.
Wild-type (RP437) E. coli response to blue light. Gray zones indicate exposure to blue light. (A) Motile response to turn-off and turn-on of blue light after a 10-second interval. Reference lines indicate prestimulus mean RCD (dashed) and its frame-to-frame standard deviation (dotted) for the 1 second prior to shutter closure. The value for smooth-swimming mutant E. coli is given by the dashed-dotted line. (B) Action spectrum. Open circles denote relative responses ± standard errors. Continuous line denotes superimposed absorption spectrum of proflavin. (C) Response to 0.3-s blue-light pulse. Reference lines indicate the prestimulus mean RCD and its ± frame-to-frame standard deviation as in panel A. (D) Smooth-swimming response on turn-off of blue light. (E) Tumbling response to turn-on of blue light. Lines in panels D and E are best exponential fits.

