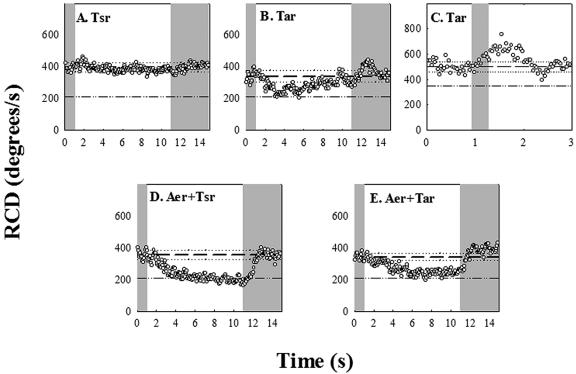
FIG. 4.
Chromosomal-deletion mutants. The gray zones indicate exposure to blue light, and the reference lines indicate the RCD values prior to shutter closure and the value for smooth-swimming populations, as in Fig. 3A. (A) UU1615; (B) UU1624; (C) UU1624 response to a 0.3-second pulse (lines denote prestimulus RCD [dashed] plus frame-to-frame standard deviations [dotted]); (D) RP8606; (E) UU1623.

