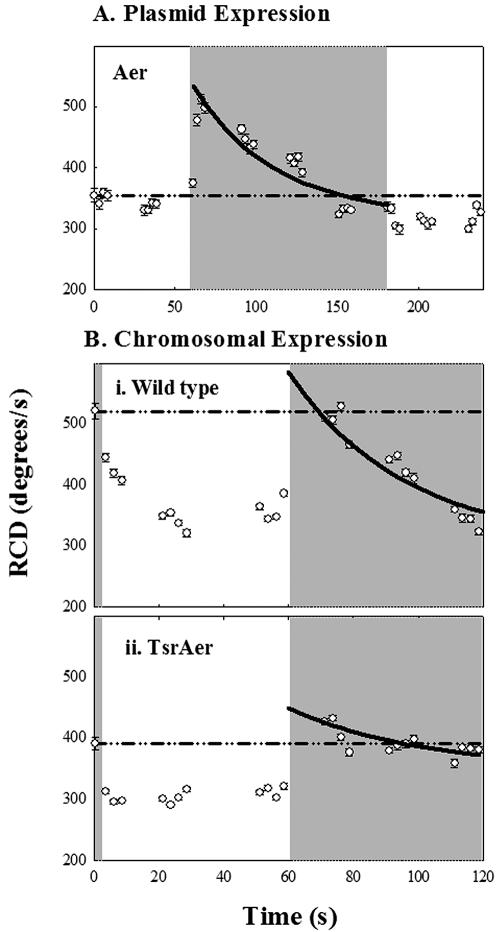
FIG. 6.
Recovery kinetics of the Aer-mediated response. The gray zones indicate exposure to blue light. Symbols denote mean RCD values averaged over 2.5 seconds (38 frames) ± standard errors. The dashed-dotted reference lines indicate the mean RCD values for the first second in all sequences. Solid lines denote single exponential fits to the adaptation phase of the response to turn-on of blue light. (A) Recovery in pKG117/UU1250 of a nonsaturation response to a 2-minute step of blue light. (B) Recovery of (i) RP437 and (ii) RP8606 populations to a 1-minute step of blue light.

