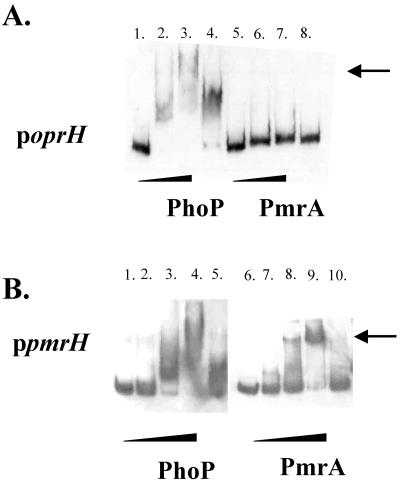
FIG. 3.
Demonstration of binding of PhoP and PmrA to selected promoter regions: examples of results of gel shift assays for oprH and pmrH. (A) The entire intergenic region between napE (PA1177) and oprH (PA1178) was amplified by PCR and end labeled with DIG. The preparation was incubated with different concentrations of purified His6-PhoP or His6-PmrA as described in Materials and Methods. All lanes contained 40 pg of labeled probe. Lane 1, no protein; lane 2, 2.5 μg His6-PhoP; lane 3, 5 μg His6-PhoP; lane 4, 5 μg His6-PhoP preincubated with 100 ng unlabeled probe; lane 5, no protein; lane 6, 2.5 μg His6-PmrA; lane 7, 5 μg His6-PmrA; lane 8, 5 μg His6-PmrA preincubated with 100 ng unlabeled probe. (B) The entire intergenic region between algA (PA3551) and pmrH (PA3552) was amplified by PCR and end-labeled with DIG. The preparation was incubated with different concentrations of purified His6-PhoP or His6-PmrA as described in Materials and Methods. All lanes contained 40 pg of labeled probe. Lane 1, no protein; lane 2, 1.25 μg His6-PhoP; lane 3, 2.5 μg His6-PhoP; lane 4, 5 μg His6-PhoP; lane 5, 5 μg His6-PhoP preincubated with 100 ng unlabeled probe; lane 6, no protein; lane 7, 1.25 μg His6-PmrA; lane 8, 2.5 μg His6-PmrA; lane 9, 5 μg His6-PmrA; lane 10, 5 μg His6-PmrA preincubated with 100 ng unlabeled probe.

