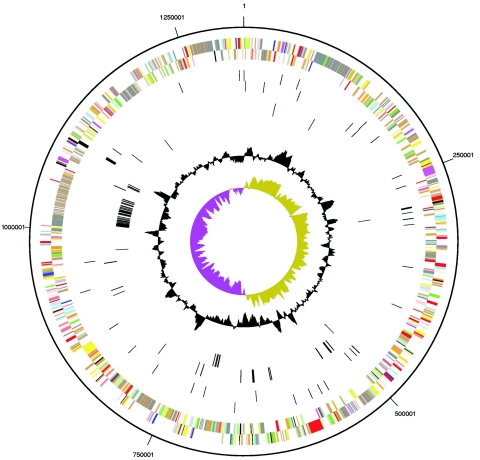
FIG. 1.
Circular representation of the genome of E. canis. From outside to inside, the first two circles represent COG assignment for predicted coding sequences on the plus and minus strands, respectively. Colors indicate the following: dark gray, hypothetical proteins; light gray, conserved hypothetical and unknown function; brown, general function prediction; red, replication and repair; green, energy metabolism; blue, carbon and carbohydrate metabolism; cyan, lipid metabolism; magenta, transcription; yellow, translation; orange, amino acid metabolism; pink, metabolism of cofactors and vitamins; light red, purine and pyrimidine metabolism; lavender, signal transduction; and sky blue, cellular processes. The third and fourth circles represent RNA genes. The fifth and sixth circles represent unique coding sequences. The two innermost circles represent the %G+C content and G+C skew values, respectively.

