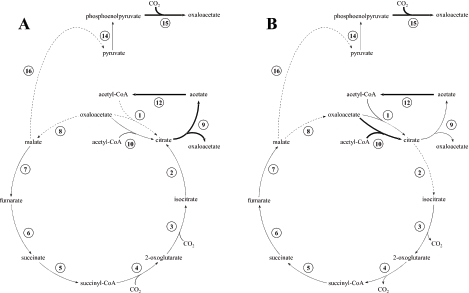
FIG. 3.
Models for carbon flow during autotrophic growth (A) and growth with acetate (B). The boldface arrows and dashed arrows indicate enzyme activities that were significantly higher and lower, respectively, than the activities in heterotrophically grown cells. Pyruvate synthase and acetate:CoA ligase (ADP-forming) activities (reactions 11 and 13) are not present in either model. The numbers indicate enzymes as described in the legend to Fig. 1.

