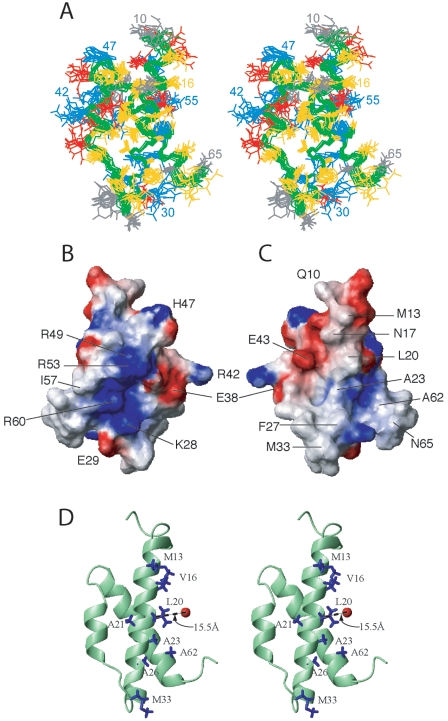
FIG. 2.
NMR-determined structures of the θ subunit in complex with ɛ186. (A) Stereo view of superposition of the backbone heavy atoms from the final ensemble of the 12 lowest-energy structures refined with distance, torsion angle, and pseudocontact shift restraints. Superposition was accomplished using the backbone atoms of Q10 to L66. (B and C) Calculated charge distribution mapped onto the surface of the θ subunit (residues 10 to 66). The regions with basic potential are indicated by blue, the regions with acidic potential are indicated by red, and white regions are uncharged regions of the θ surface. The mean structure is displayed, and the molecule in panel B has the same orientation as the stereo views in panels A and D, with helix 3 on the left, helix 1 in the center, and helix 2 on the right, whereas the molecule in panel C is rotated 180° about the vertical axis. (D) Stereo view of ɛ186-bound θ, showing some methyl-bearing side chains and the calculated position of the lanthanide ion in the active site of ɛ186. The side chains of methyl-bearing residues that showed substantial differential attenuation in the NOE difference experiment (>0.5) are blue. The approximate point of closest approach of the metal ion to the backbone is indicated. The coordinates are available from the PDB (PDB code 2AXD).

