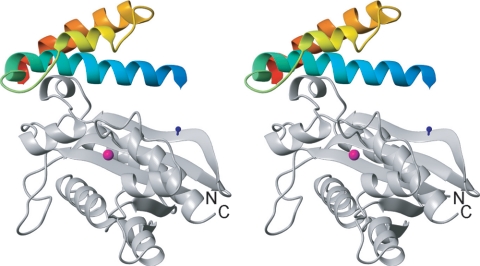
FIG. 6.
Stereo representation of the structure of the θ-ɛ186 complex as determined from pseudocontact shifts induced by Dy3+ and Er3+ ions (46). Residues 10 to 66 are included in the ribbon representation of θ, and the amino and carboxy termini are indicated by blue and red, respectively. The position of the lanthanide ion is indicated by the magenta sphere. The amide proton of H49 in ɛ186, which makes an NOE with the amide proton of A6 in θ (46), is indicated by a blue ball-and-stick diagram. The N and C termini of ɛ186 are labeled.

