FIG. 1.
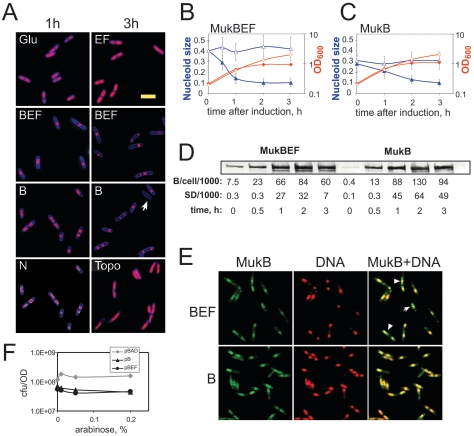
Chromosome condensation by overproduced MukBEF and MukB. (A) DH5α cells harboring an appropriate plasmid were grown in LB medium up to an OD600 of 0.2, and the production of MukB (B), MukBEF (BEF), MukEF (EF), or E. coli topoisomerase I (Topo) was induced by the addition of arabinose or repressed by the addition of glucose (Glu). The cells were fixed 1 h or 3 h after induction and analyzed by fluorescence microscopy. The images were quantified using Nucleus. The cell boundaries were determined from SyproOrange staining. The bottom-left panel (N) shows spot recognition by Nucleus for the image obtained for MukB overproducers. The arrow indicates a cell almost completely devoid of DNA. Size bar, 5 μm. (B and C) Growth curves (diamonds) and normalized chromosome sizes (triangles) as functions of time after the MukBEF-overproducing cells (B) or MukB-overproducing cells (C) were supplemented with arabinose (closed symbols) or glucose (open symbols). For any given cell, the sizes of all nucleoids were summed and divided by the area of the cell. The average values for 150 to 200 cells are shown. Error bar, standard deviation. (D) The amount of MukB in MukBEF- and MukB-overproducing strains. OD units (0.001) of cells were mixed with sodium dodecyl sulfate-polyacrylamide gel electrophoresis gel loading buffer, boiled for 5 min, and analyzed by Western blotting using anti-MukB antibody. For the zero time points, we used 0.05 OD units of cells. For each time point, the amount of MukB was quantified as described in Materials and Methods and the data were expressed as the number of MukB monomers per cell. The averages for two independent experiments are shown together with the standard deviations (SDs). (E) Colocalization of the overproduced MukB with DNA. OU103 cells, which carry a MukB-GFP fusion on the chromosome, were transformed with the plasmids that overproduced MukBEF (top row) or MukB (bottom row), grown in LB medium, and induced with arabinose at an OD600 of 0.2. After 3 hours of induction, the cells were stained with Hoechst 33342 and observed by fluorescence microscopy. The left panels (MukB) show GFP fluorescence; the middle panels (DNA) show Hoechst fluorescence; the overlay of these two images is shown on the right panels (MukB+GFP). (F) The overproduction of MukBEF or MukB does not reduce the formation of colonies in LB. DH5α cells harboring pBAD, pBB10, or pBB03 were grown in LB at 37°C up to an OD600 of about 0.2, diluted, and spread on LB plates supplemented with 100 μg/ml ampicillin and the indicated amounts of arabinose, and the plates were further incubated at 37°C overnight.

