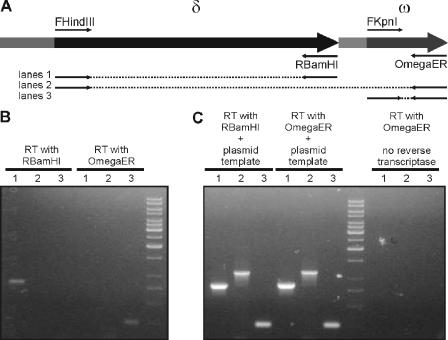
FIG. 5.
RT-PCR analysis of the region encompassing the δ and ω genes. (A) Schematic representation of δ-ω region, with positions of primer sites used for amplification. (B) PCR amplification of δ (lanes 1), δ-ω (lanes 2), or ω (lanes 3) from cDNA templates generated with primers RBamHI and OmegaER. (C) Positive controls for PCR (plasmid DNA added to the template generated by RT) and negative controls for RT reactions (lack of reverse transcriptase in the RT reaction mixture). The products in lanes 1 to 3 in panels B and C were generated with the same primers.

