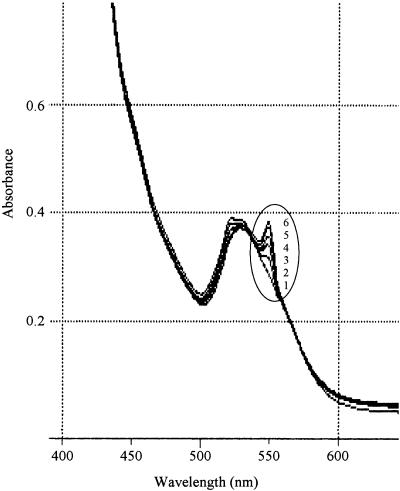
FIG. 4.
Time course of the absorption spectra of cytochrome c in the reaction mixture containing 4-phospho-d-erythronate and a cell extract of S. meliloti 16C18/pVK-pdxR in buffer. Curve 1, zero time; curve 2, after 2 min; curve 3, after 5 min; curve 4, after 10 min; curve 5, after 15 min; curve 6, after 20 min.

