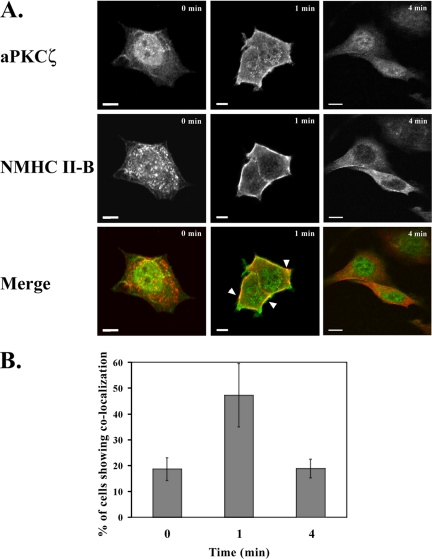
Figure 3.
EGF-dependent localization of NMHC II-B and aPKCζ in TSU-pr1 cells. (A) Immunofluorescence staining of aPKCζ (top panels, green) and NMHC II-B (middle panels, red) in TSU-pr1 cells stimulated with EGF for 0, 1, or 4 min. Areas of colocalization are yellow and are indicated with arrowheads (Merge). Bar, 10 μm. (B) Quantification of the number of cells that exhibit colocalization between NMHC II-B and aPKCζ at each time point after EGF stimulation. The results are presented as mean ± SD of the percentage of cells that show colocalization out of the total number of random cells counted in three independent experiments (average total cells counted for each time point: n = 180).

