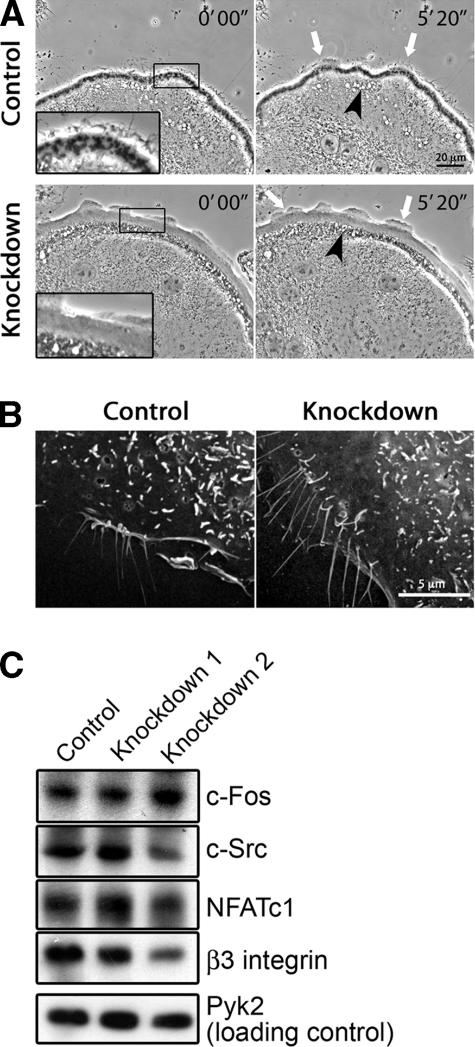
Figure 6.
Effect of cortactin depletion on podosomes, membrane protrusions, and osteoclast maturation. (A) Membrane and cell edge dynamics in time-lapse phase-contrast microscopy movies of osteoclasts expressing scrambled or cortactin RNAi sequence 2. These images are frames from Supplemental Movies 1 and 2. Podosomes are seen as phase-dark puncta just behind the cell edge in control cells. Cortactin-depleted cells show no podosomes. Control and cortactin-depleted cells exhibit dynamic membrane protrusions, including lamellipodia (white arrows). Rapidly moving phase-light and phase-dark vesicles are seen farther back from the cell edge in control and knockdown cells (black arrowheads). These vesicles may be endocytic. (B) Scanning electron microscopy of osteoclasts expressing scrambled or cortactin RNAi sequence 1. Control and cortactin-depleted cells show filopodia-like structures and dorsal membrane protrusions. (C) Immunoblot of osteoclast markers in cells expressing control scrambled RNAi, knockdown sequences 1 or knockdown sequence 2. Pyk2 is a loading control. All four osteoclast markers tested are present in control and cortactin-depleted cell samples.

