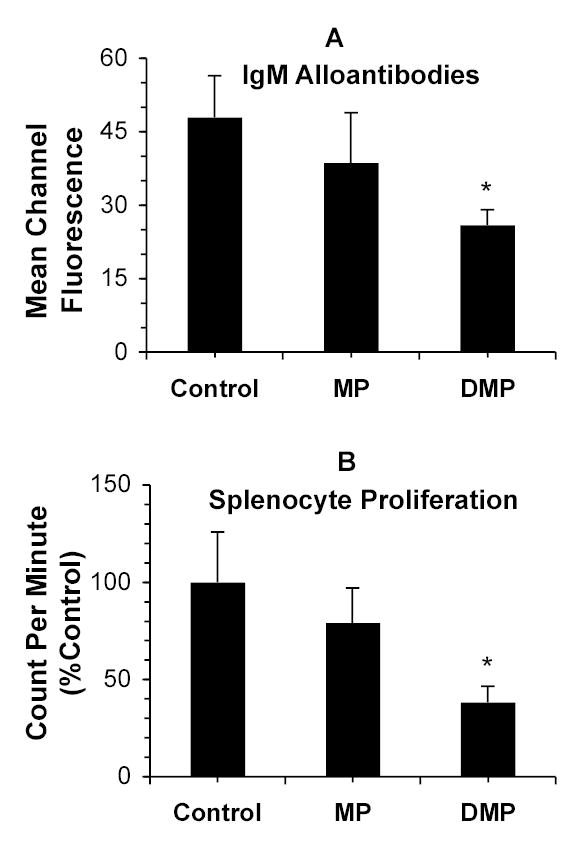
FIGURE 6.

Top Panel: Donor (DA)-specific IgM alloantibody response (mean channel fluorescence) in the 9-day sera of recipient (Lewis) rats treated with a single 5-mg/kg i.v. dose of MP or DMP or with saline (Control) on day 0 (n=4/group), quantitated using flow cytometry. Bottom Panel: Splenocyte proliferation (count per minute) in naïve Lewis rats treated with vehicle (Control) or a single 5 mg/kg dose (MP equivalent) of MP or DMP 9 days before spleen harvest (n=3/group). Columns and bars represent mean and SD values, respectively. *, Significantly different (P<0.05) from Control.
