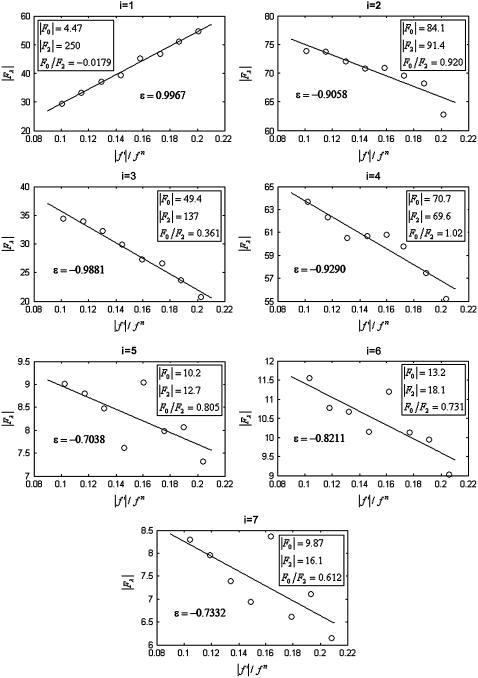
FIGURE 1.
 (ordinate) is plotted against
  (abscissa) for the seven lamellar peaks, order i = 1–7. The data on each panel was fit by a straight line; ɛ is the correlation coefficient of the fit. From Eq. 3, the intercept of the line gives
  ; the magnitude of the slope gives
  ; and the sign of the slope gives the sign of

