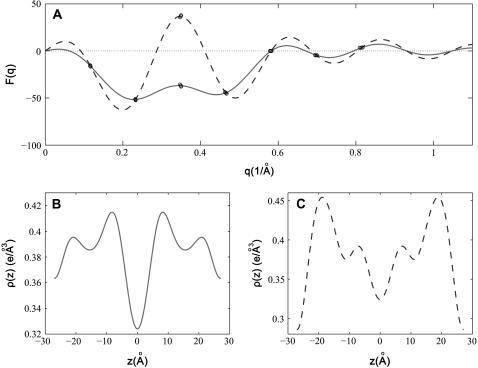
FIGURE 4.
The results of the swelling method on the lamellar phase of di18:0(9,10dibromo)PC, measured on a laboratory diffractometer using Cu Kα radiation. (A) The phasing diagram by the swelling method. The three data points (circles) measured at 89%, 90%, and 91%RH partially overlap. The solid and dashed lines are the Shannon constructions (4,5) for different choices of sign for the third order. (B) The electron density profile if the third order is negative. This profile is slightly different from Fig. 3 B. It could be due to a difference in the hydration level—the two hydrometers used in the two different experiments were not calibrated to each other. (C) The electron density profile if the third order is positive. (In panels B and C, we used the same electron density normalization constants that were obtained for Fig. 3.)

