FIGURE 4.
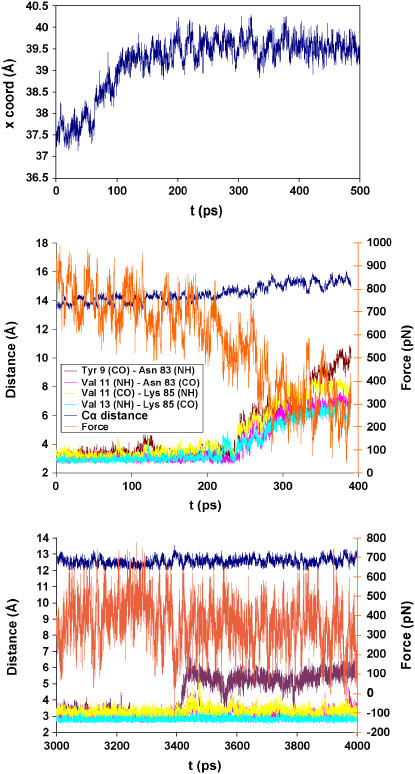
(Top panel) Behavior of the x-coordinate of the Cα of the C-terminal leucine (Leu-89) during a 500-ps simulation. (Middle panel) Distances between H-bond donors and acceptors of β-strands A′ and G of I27 during the extended simulations of Set A. Additionally the elastic force and the distance between the starting and final position of the pulled Cα are shown. (Bottom panel) Behavior of the H-bond between Tyr-9 (CO) and Asn-83 (HN) in a run of set B during the last nanosecond of simulation. Additionally, the elastic force and distance between the starting and final position of the pulled Cα are shown.

