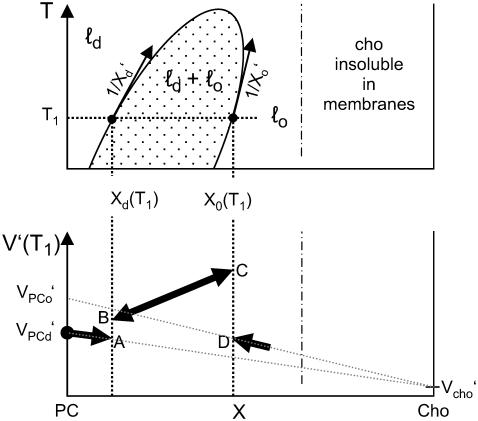
FIGURE 1.
Schematic illustration of the phase model. (Top) Phase diagram with liquid-disordered (ℓd), liquid-ordered (ℓo), and ℓd + ℓo coexistence (dotted area) ranges in the space defined by temperature T and the mol fraction of cholesterol in the membrane, X. The solubility limit of cholesterol in membranes is about X ≤ 0.66 (26) (temperature dependence unknown). (Bottom) The resulting schematic behavior of the expansivity, V′, as a function of X. See text for details.

