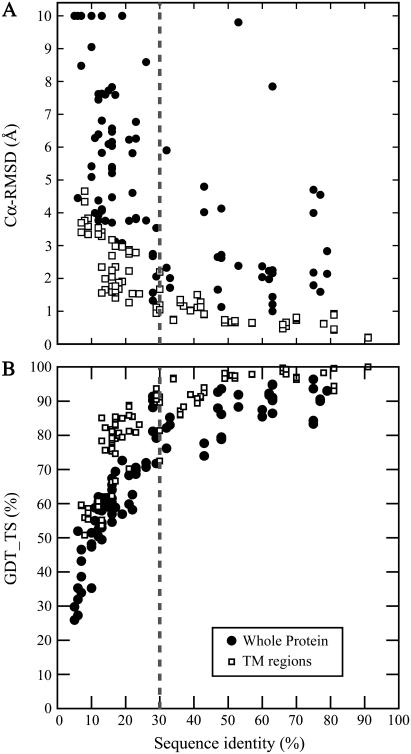
FIGURE 1.
Structural relationship between membrane protein models and their templates. The sequence identity of the structure-based (correct) alignment is plotted against (A) the Cα-RMSD and (B) the GDT_TS scores of the corresponding model compared to the native structure. Data are shown for the whole protein (•) and for the transmembrane regions (□). Six models had RMSD values of between 10 and 40 Å; for clarity these points are plotted at RMSD = 10 Å.

