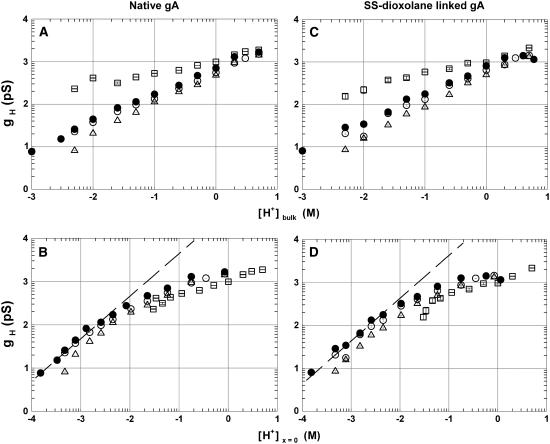
FIGURE 1.
Log-log plots of gH versus [H+]bulk (A and C) or [H+]x=0 (B and D) for the native gA (A and C) and the SS-dioxolane linked gA dimmer (B and D). Distinct symbols correspond to single channel conductance measurements in various phospholipid membranes (POPC (○), POPE (▵), DiPhPC (•), and POPG (□)). Points were plotted as mean ± SE. See text for the evaluation of [H+]x=0.

