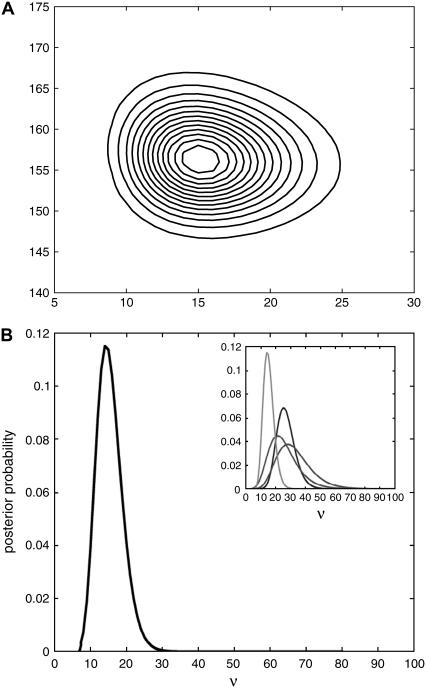
FIGURE 2.
Results of Method II applied to the data of Fig. 1. (A) A contour plot of the posterior probability of σ and ν. The distribution has a single peak with a most probable value of ν ≃ 15 ± 4 fluorescence units per fluorescent particle and of σ ≃ 156 ± 5 fluorescence units. (B) The posterior marginalized over σ. The most probable value of ν is given at the maximum and the error in this estimate by the peak width at half-maximum. The inset shows the marginalized posteriors for the data of Fig. 1 (left curve) and for three other data sets taken on the same microscope on the same day. Inferred values of ν are consistent.

