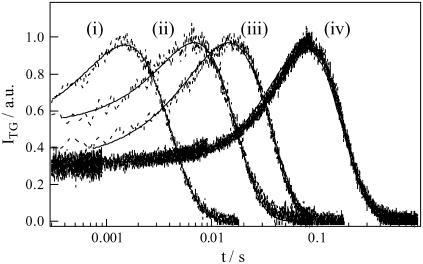
FIGURE 2.
Normalized TG signals of concentrated solution of BLUF domain of AppA (0.95 mM) at various q2 conditions. The q2 are i), 4.5 × 10¹² m−2, ii), 1.3 × 10¹² m−2, iii), 5.6 × 10¹¹ m−2, and iv), 1.3 × 10¹¹ m−2. The best fitted curve based on Eq. 3 is shown by the solid line.

