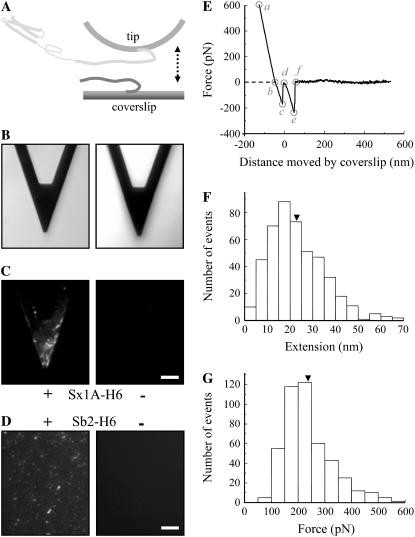
FIGURE 1.
(A) Schematic of experimental approach. Recombinant Sb2 (Sb2-H6) is attached to the nickel-coated coverslip surface through histidine residue tags (H6) at its C-terminus, leaving its cytoplasmic domain free to interact with the recombinant Sx1A (Sx1A-H6) that is similarly attached by means of a C-terminus histidine tag to the nickel-coated cantilever tip. These two proteins are brought to near proximity (approach; arrow pointing down) by means of the piezoelectric element and then taken apart (retract; arrow pointing up). (B) Bright-field images of the cantilevers that were subjected to indirect immunochemistry in C. Cantilevers incubated with Sx1A-H6 (+) were successfully functionalized as indicated by the positive immunoreactivity when compared to the control cantilevers where Sx1A-H6 (−) was omitted from the incubation solution (C). (D) Coverslips functionalized with Sb2-H6 (+) showed positive immunoreactivity when compared to control coverslips where Sb2-H6 (−) was not attached to the coverslip. (E) The retraction part of a typical force-distance (extension) curve using a Sx1A-H6 functionalized tip and a Sb2-H6 functionalized coverslip. In the segments ab and bc (see “Results” for details), the coverslip and the cantilever tip are still in contact. The Sx1A-Sb2 intermolecular bond starts to be extended at point d, which represents the point of zero separation distance between the tip and coverslip. The increasing extension as the coverslip moves further away from the tip leads to increased application of the force on the intermolecular bond until it ruptures at point e. The segment ef is then the measure of the force (ordinate) necessary to remove Sx1A-Sb2 interaction. The extension induced can be calculated from the z-axis distance moved by the piezo (abscissa) given by segment de. In the example shown in E the force measures 237 pN, whereas the extension at rupture is 23 nm. The dashed line indicates zero force, whereas its intercept with the force-distance curve indicates point b. Circles indicate different points within the force-distance curve. Distributions of the forces and corresponding extensions at rupture for Sx1A-Sb2 single intermolecular bonds are shown in F and G, respectively. Arrowheads in F and G indicate the mean values. The drawing in A is not to scale. Retraction velocity, 1.6 μm/s. Scale bar, 30 μm in B and C, whereas 10 μm in D.

