Figure 1.

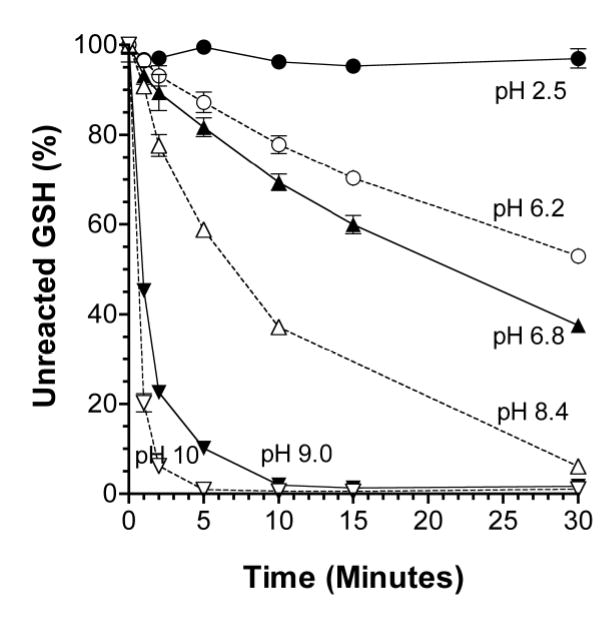
The time courses of the reaction of M4VP with GSH under different pH values, resulting in masking GSH. The M4VP: GSH ratio was fixed at 3. Symbols and bars represent the mean and SD values, respectively (n = 3).

The time courses of the reaction of M4VP with GSH under different pH values, resulting in masking GSH. The M4VP: GSH ratio was fixed at 3. Symbols and bars represent the mean and SD values, respectively (n = 3).