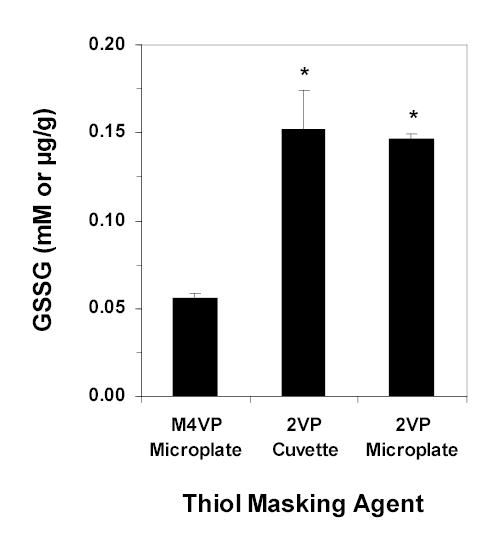
Figure 5.

The mean (columns) and SD (bars) of liver GSSG levels analyzed using M4VP as explained in this article and also using 2VP as described in an established method using cuvette [10] or microtiter plate [11]. *, Significantly different from the M4VP method (ANOVA followed by post-hoc analysis using Scheffe F test).
